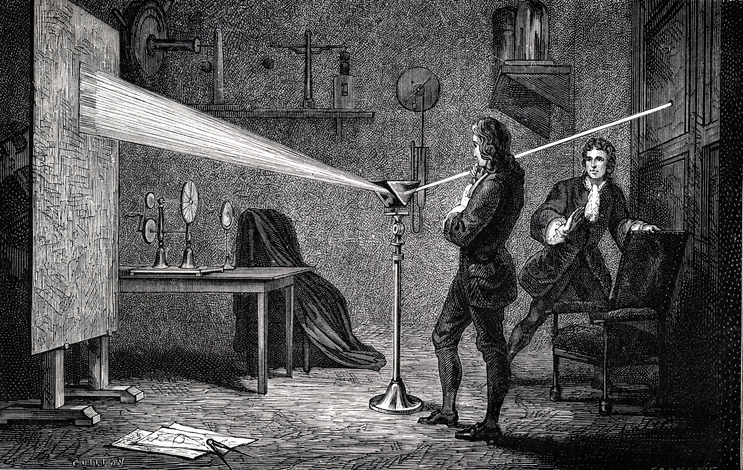
Sir Isaac Newton (1643 – 1727):
- In 1666, Newton is often credited with the earliest experiments that laid the foundation for spectroscopy. He used a prism to demonstrate that white light could be separated into its constituent colours, creating a spectrum.
- Newton’s optics experiments, which were conducted from 1666 to 1672.
- In his theoretical explanation, “Optics,” Newton described prism experiments that split white light into coloured components, which he named the “spectrum”.
The Prism Era: Early Spectrometry:
- The story begins in the 17th century with the brilliant mind of Sir Isaac Newton. His experiments with prisms led to the realization that white light could be separated into its constituent colours, creating a spectrum. This revelation marked the birth of spectrometry.
- Prism-based spectrometers became the standard for spectral analysis, allowing scientists to investigate the properties of light and materials. However, they had limitations in terms of spectral resolution and the ability to precisely measure and identify spectral lines.
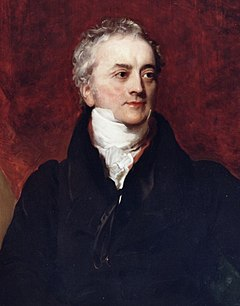
Thomas Young (1773 – 1829):
- In early 1800, English physicist named Thomas Young performed an experiment that strongly inferred the wave-like nature of light. Because he believed that light was composed of waves, Young reasoned that some type of interaction would occur when two light waves met.
- In the period 1800-1803 Thomas Young demonstrated the wave nature of light with his famous double slit experiment, and he correctly explained the colours of thin films using the undulatory theory.
- Using Newton’s measurements of this phenomenon, Young computed the wavelengths of Newton’s seven colours and obtained the range 424 to 675 nm.
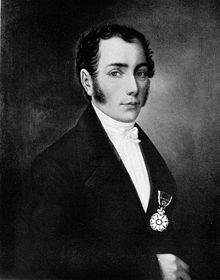
Joseph von Fraunhofer (1787 – 1826):
- In 1814, Fraunhofer made important contributions to the field when he discovered and catalogued the dark lines in the solar spectrum, now known as Fraunhofer lines. His work was crucial in the development of spectroscopy for analysing the composition of celestial bodies.
- Joseph Fraunhofer, a superb instrument maker, made a detailed examination of the solar spectrum; he made a map of 700 of the lines we now refer to as “Fraunhofer lines”.
- Fraunhofer constructed the first diffraction grating by winding wires on two finely-cut parallel screws. With these gratings he measured the first wavelengths of spectrum lines, obtaining 588.7 for the line he had labelled D. We now know that this line is a close pair of lines of Na I, whose modern wavelengths are 589.0 and 589.6 nm.
The Diffraction Grating Revolution:
History of physics that Joseph Fraunhofer created the diffraction grating in 1821. Actually, the first diffraction grating was constructed in 1786 (i.e., 35 years before Fraunhofer) by the astronomer David Rittenhouse (1732-1796).
- A diffraction grating is a precise optical component with thousands of parallel slits that disperse light in a manner similar to prisms.
- However, it offered several advantages over prisms.
- Higher resolution: Diffraction gratings could produce finer and more detailed spectral lines, enabling more accurate measurements and element identification.
- Wavelength accuracy: Gratings allowed for the determination of the exact wavelengths of spectral lines, a crucial factor in analytical chemistry.
- Spectral efficiency: They could efficiently cover a broader range of wavelengths in a single spectrum, making them highly versatile.
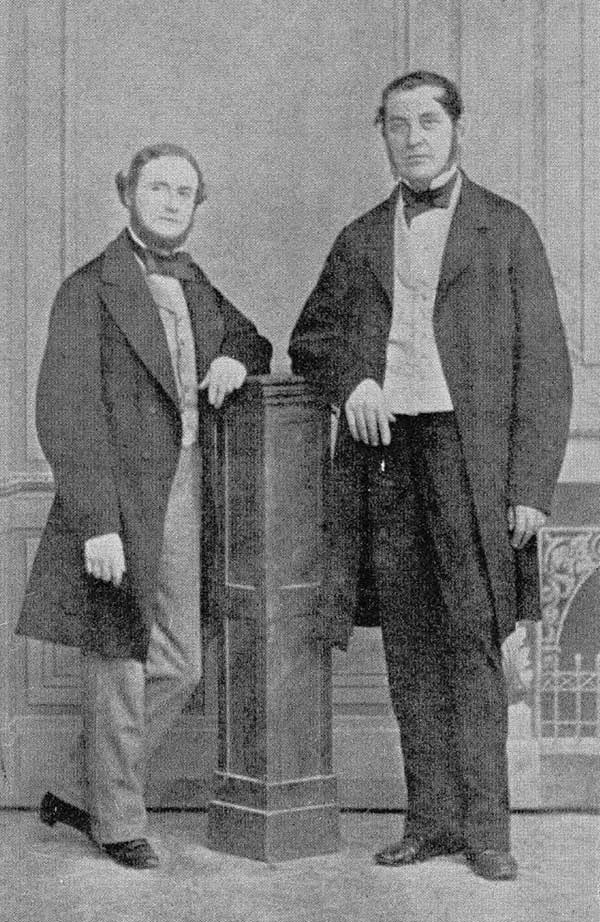
Robert Bunsen (1811 – 1899) and Gustav Kirchhoff (1824 -1887):
- Together, they developed the spectroscope, an instrument designed to examine the spectra of various substances. Their groundbreaking work in spectroscopy began with the study of the spectral lines in the Sun’s spectrum. They noticed the presence of dark lines, now known as Fraunhofer lines, which indicated absorption of certain wavelengths by elements in the Sun’s atmosphere. This discovery was instrumental in understanding the chemical composition of celestial bodies.
- Building on the foundation laid by Kirchhoff’s theoretical insights and Bunsen’s experimental prowess, the duo expanded their work to emission spectroscopy. In 1860, they published their findings on the subject. They discovered that when elements were heated and excited, they emitted light at specific wavelengths, producing bright spectral lines unique to each element. This groundbreaking development opened the door to identifying elements in a new way.
- The Kirchhoff and Bunsen partnership, through their theoretical understanding and inventive experiments, laid the groundwork for modern Optical Emission Spectroscopy. Scientists now had a powerful tool for elemental analysis, allowing them to identify the composition of substances with unprecedented accuracy.
- The legacy of Kirchhoff and Bunsen’s collaboration is still felt today. Optical Emission Spectroscopy (OES) has become an essential analytical technique in various fields, from metallurgy and chemistry to astronomy and environmental science.
Wet Chemical Analysis to Spectrometer:
Wet Chemical Analysis:
Wet chemical analysis, also known as classical analysis or wet chemistry, relies on chemical reactions in solution to determine the composition of a sample. It involves techniques where substances are dissolved, mixed, and reacted, often leading to observable changes such as colour shifts, precipitate formation, or changes in pH
18th Century Enlightenment: The Birth of Quantitative Analysis:
The 18th century was a pivotal period in the history of analytical chemistry. Antoine Lavoisier, often referred to as the “father of modern chemistry,” introduced the concept of systematic quantitative analysis. His work on the law of conservation of mass and the recognition and understanding of chemical elements provided a solid foundation for standardized analytical techniques.
Applications: Spectrometers have become essential tools in various scientific disciplines and industries, including:
Spectrophotometry: Quantifying the concentration of a substance by measuring its light absorption.
Spectrofluorimetric: Analysing the fluorescence of compounds for identification.
Mass Spectrometry: Determining the mass-to-charge ratios of ions in a sample.
Precision and Speed: Spectrometers offer high precision and rapid analysis, making them suitable for quantitative and qualitative analyses. They are particularly valuable for identifying and quantifying substances in trace amounts.
Wet Chemical Analysis vs Spectrometer:
- Spectrometers are often more sensitive and can detect substances in smaller quantities compared to wet chemical analysis.
- Spectrometry is generally faster, providing results in real-time or with minimal delay, while wet chemical analysis can be time-consuming.
- Wet chemical analysis often requires sample preparation through chemical reactions, whereas spectrometers usually analyse samples directly without extensive conditioning.
- Spectrometers are generally more sensitive than wet chemical analysis and can detect substances in smaller quantities.
- Spectrometers have found applications in various scientific disciplines and industries. They include spectrophotometry (quantifying the concentration of a substance by measuring its light absorption), spectrofluorimetric (analysing the fluorescence of compounds for identification), and mass spectrometry (determining the mass-to-charge ratios of ions in a sample).
The Rise of Atomic Emission Spectrometers:
- One of the key milestones in the development of AES was the collaboration between Gustav Kirchhoff and Robert Bunsen in the mid-19th century. They not only identified the spectral lines of elements in the Sun but also developed the spectroscope, an instrument for studying these lines. Their work led to the understanding that each element produced a unique set of emission lines, like a fingerprint, which opened the door to element identification and analysis.
- The principles established by Kirchhoff and Bunsen laid the groundwork for the creation of Atomic Emission Spectrometers. These instruments are designed to analyse the emission spectra of elements by heating or exciting a sample, causing it to emit light. The emitted light is then dispersed and detected, allowing for the identification and quantification of elements based on their unique emission lines.
- Over the years, AES technology has evolved significantly. The early AES instruments used flames as excitation sources, limiting their applicability to certain elements. The introduction of more advanced excitation sources, such as inductively coupled plasma (ICP) and spark sources, expanded the capabilities of AES to analyse a broader range of elements.
- The rise of AES has had a profound impact on various industries. In metallurgy, AES is widely used for quality control and the analysis of the elemental composition of metals and alloys. Environmental agencies use AES to monitor pollutants and contaminants in air, water, and soil. It also plays a vital role in geology, archaeology, and materials science.
- In recent years, advancements in technology have made AES instruments more sensitive, accurate, and capable of analysing complex samples. Computer software allows for easier data analysis and interpretation. Additionally, automation and robotics have improved the efficiency of AES, making it an invaluable tool in laboratories.
Detectors:
In Optical Emission Spectroscopy (OES), detectors play a pivotal role in capturing and analysing the emitted light from excited atoms or ions. OES is a powerful analytical technique used for identifying and quantifying elements in a sample based on the characteristic wavelengths of light they emit when excited.
How detectors are used in OES:
- The primary function of detectors in OES is to collect the emitted light from the sample. When a sample is excited, atoms or ions emit light at specific wavelengths, which are characteristic of the elements present. Detectors collect this emitted light and convert it into electrical signals.
- Detectors in OES instruments are equipped with the ability to analyse the wavelengths of the collected light. Each element emits light at specific wavelengths, and the detector’s wavelength analysis capability allows for the identification of these emission lines, enabling the determination of which elements are present in the sample.
- In addition to identifying the elements, detectors also measure the intensity of the emitted light at each wavelength. This information is crucial for quantifying the concentration of elements in the sample. The greater the intensity of the emitted light, the higher the concentration of the corresponding element.
- Detectors convert the optical signals from the emitted light into electrical signals that can be processed and analysed by the spectrometer. These electrical signals are then used to generate a spectrum that displays the intensity of light at different wavelengths.
- The sensitivity of detectors is critical in OES, especially when analysing trace elements in samples. A more sensitive detector can detect weaker emission lines, which is essential for identifying and quantifying elements present in low concentrations.
- The stability of detectors is essential for consistent and reproducible results. Stable detectors ensure that measurements remain accurate over time and between different analyses.
Type of Detector:
1. Photomultiplier tube (PMT)
2. Charge-coupled device (CCD)
3. Complementary metal-oxide semiconductor (CMOS)
1. The Photomultiplier Tube (PMT):
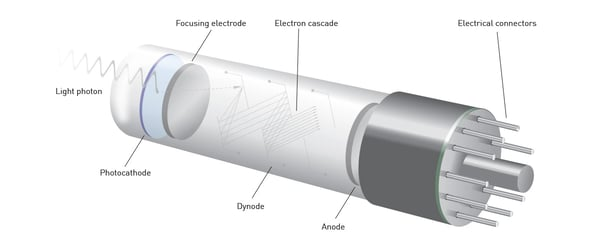
The Photomultiplier Tube (PMT) is a light-sensitive device that converts photons into an electrical signal. Its history dates back to the early 20th century, and its development has been crucial for advancements in various scientific and technological fields.
The PMT was invented by Hungarian physicist and engineer, Imre Bródy, in the 1930s. Bródy’s work aimed to create a device that could amplify weak optical signals.
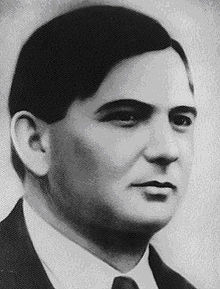
Imre Bródy (1891-1944)
Use of PMT Detectors in Optical Spectrometers:
Light Detection:
- Photomultiplier Tube (PMT) detectors are extensively used in optical spectrometers for the detection of light.
- When photons strike the photocathode of a PMT, they release electrons through the photoelectric effect.
Wavelength Analysis:
- PMTs are highly sensitive to low levels of light, making them suitable for capturing weak signals in optical spectroscopy.
- PMTs provide excellent wavelength resolution, allowing for the precise identification of spectral lines.
Advantages of PMT Detectors in Optical Spectrometers:
- High sensitivity to low light levels, crucial for capturing weak signals.
- Excellent wavelength resolution for precise identification of spectral lines.
- Fast response time, enabling real-time or time-resolved measurements.
- Versatility across various spectroscopic techniques.
2. Charge-coupled device (CCD):
- The Charge-Coupled Device (CCD) was invented by Willard Boyle and George E. Smith at Bell Labs in 1969. Their work later earned them the Nobel Prize in Physics in 2009.
- The first practical CCD was created in the early 1970s, and it found initial applications in video cameras and astronomical imaging.
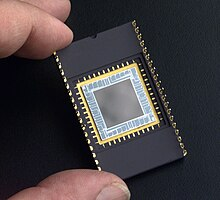

- Throughout the 1980s, CCD technology advanced rapidly, leading to improved sensitivity, resolution, and lower noise levels. This led to the widespread adoption of CCDs in various scientific and industrial applications and in the 1990s, CCDs became the dominant technology for digital imaging in astronomy, microscopy, and other fields. They also became common in consumer digital cameras.
- CCDs continued to evolve, with improvements in pixel count, readout speed, and sensitivity. However, in recent years, other sensor technologies like CMOS (Complementary Metal-Oxide-Semiconductor) sensors have gained popularity in certain applications.
Use of CCD (Charge-Coupled Device) Detectors in Optical Spectrometers:
Light Detection:
- CCD detectors convert incident photons into electrical charge within individual pixels and CCDs typically have high quantum efficiency, capturing a significant percentage of incident photons.
Wavelength Analysis:
- CCD detectors provide high wavelength resolution, allowing for the precise identification of spectral lines and CCDs cover a broad spectral range, making them versatile for various applications across the electromagnetic spectrum.
Advantages of CCD Detectors in Optical Spectrometers:
- CCD detectors are highly sensitive to low levels of light, allowing for the detection of weak signals.
- Provides precise identification of spectral lines.
- Suitable for real-time or time-resolved measurements.
- Applicable across various spectroscopic techniques and applications.
3. Complementary metal-oxide semiconductor (CMOS):
- The basic CMOS technology was initially developed in the 1960s. However, the application of CMOS technology to image sensors took more time to mature.
- Early applications of CMOS technology in imaging started to emerge in the 1970s and 1980s. However, these early CMOS image sensors faced challenges such as low resolution and image quality
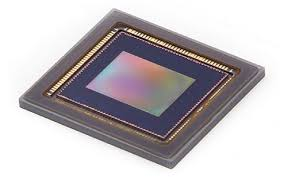
- The 1990s saw significant advancements in CMOS image sensor technology, leading to improved performance, resolution, and noise characteristics
- By the early 2000s, CMOS image sensors became commercially viable and started to gain widespread adoption in consumer electronics, such as digital cameras and mobile phones.
- CMOS technology continued to advance, and CMOS image sensors became the dominant technology in various applications, including scientific imaging, medical imaging, automotive cameras, and more.
Use of CMOS Detectors in Optical Spectrometers:
Light Detection:
- CMOS detectors convert incident photons into electrical charge within individual pixels, similar to other detector technologies and CMOS detectors often exhibit high quantum efficiency, capturing a significant portion of incident photons.
Wavelength Analysis:
- CMOS detectors provide high-resolution imaging, allowing for precise identification of spectral lines and CMOS detectors cover a broad spectral range, making them suitable for various optical spectroscopy applications.
Advantages of CMOS Detectors in Optical Spectrometers:
- Suitable for portable or battery-powered spectrometer applications.
- Ideal for real-time or time-resolved spectroscopy.
- Enables the creation of compact and miniaturized spectrometer systems.
- CMOS technology is cost-effective, making it accessible for a wide range of applications.
